May 9th Update: Cooling Template; Pest And Disease Models
- Phytech Team

- May 11, 2023
- 2 min read
We're happy to share our latest Plant and Planner app update, May 9th, designed to help growers simplify and optimize their day-to-day horticultural practices.
*Pls note that to enjoy the latest version of the Plant App customers must actively update the app on Google Play (android phones) or the App store (iOS phones)
**Pls note that to enjoy the latest version of the Planner App only Android customers must actively update the app on Google Play
Highlights:
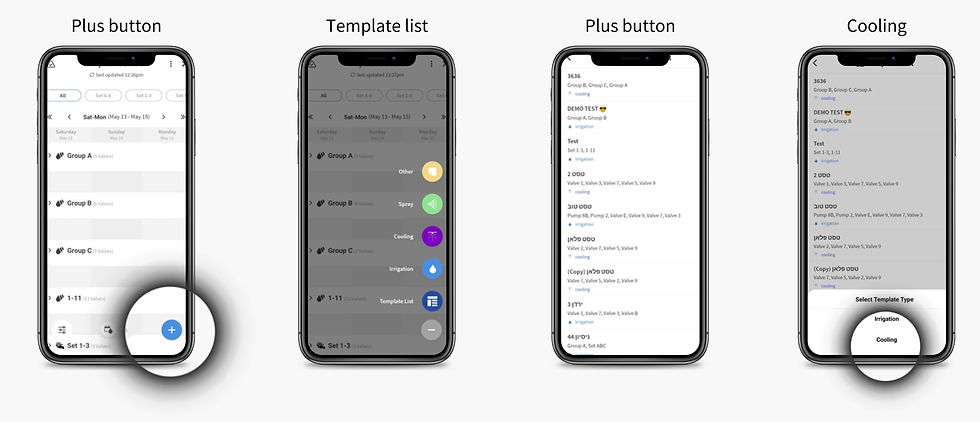
Planner Mobile New Feature - The Cooling Template
Pest & Disease Management - Fireblight and Codling Moth Models
System Monitoring - Daily Consumption On The History Graph
Plant Mobile - Adding Saturation Scale To The Soil Moisture Graph
Let's Grow!

Planner Mobile - Cooling Template
Phytech's cooling template allows users to easily schedule their automated cooling process, based on ready-to-use plans.
*Pls note that to enjoy the latest version of the Planner App only Android customers must actively update the app on Google Play (android phones). iOS users don't have to actively update their apps


Pest & Disease Management - The models are here
Just in time for the apples and pears blossom period in Washington and other parts of the Northern Hemisphere, we have 2 models to help with Pest & Disease Management. This feature is available only by request and requires a weather station or Phytech's temperature and humidity sensors
The FireBlight Model
Relevant crops: apple, pear
The feature is based on the WSU Cougar Fireblight model. For further reading click here
Users will be notified when rain or high humidity is expected
*This feature will be opened upon request by the CSM, and requires a weather station or Phytech's temperature and humidity sensors .

Codling Moth GDD Model
Relevant crops: apple, pear
The feature is based on GDD model
The grower or PCA - define biofix (start day)
*This feature will be opened upon request by the CSM, and requires a weather station or Phytech's temperature and humidity sensors.

System Monitoring - Daily Consumption On The History Graph
We've added a new data layer: the daily irrigation and fertigation consumption for each hydraulic component
Users can now view the calculated daily volume of water and fertilizer that has been consumed from the component
Daily Irrigation Consumption:

Daily Fertigation Consumption:

Plant Mobile - Adding Saturation Scale To the Soil Moisture Graph


Comments